Public Status Pages
Status pages let you share your website’s health with the world, like the status.yourcompany.com pages you’ve seen from major services. Built directly on top of your uptime monitors, a status page gives your users a public, always-up-to-date view of your services: current status, 90 days of uptime history, and a timeline of incidents, all under your own branding.
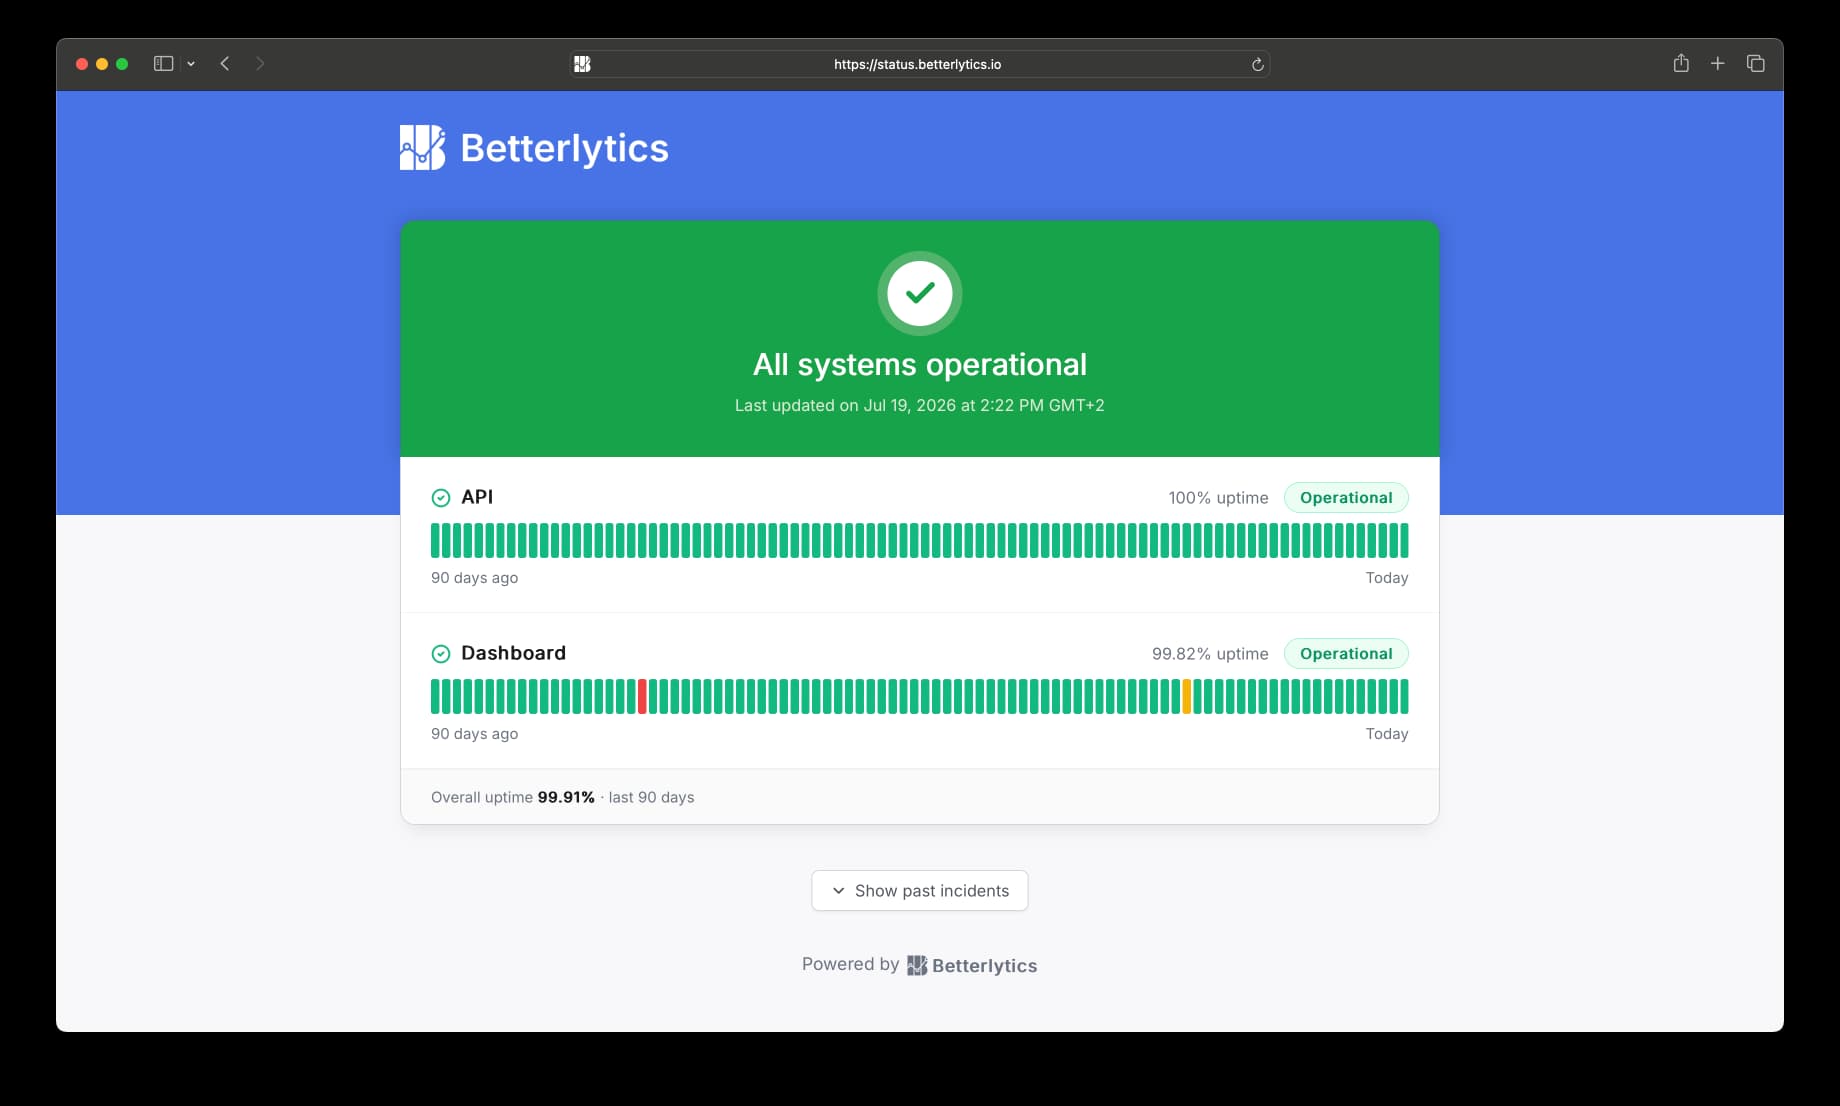
Status pages are powered by your uptime monitors, so you need at least one monitor before you can create a page. If you haven’t set up monitoring yet, start with the Uptime Monitoring guide.
Creating a Status Page
- Navigate to Dashboard > Status Pages
- Click Create status page
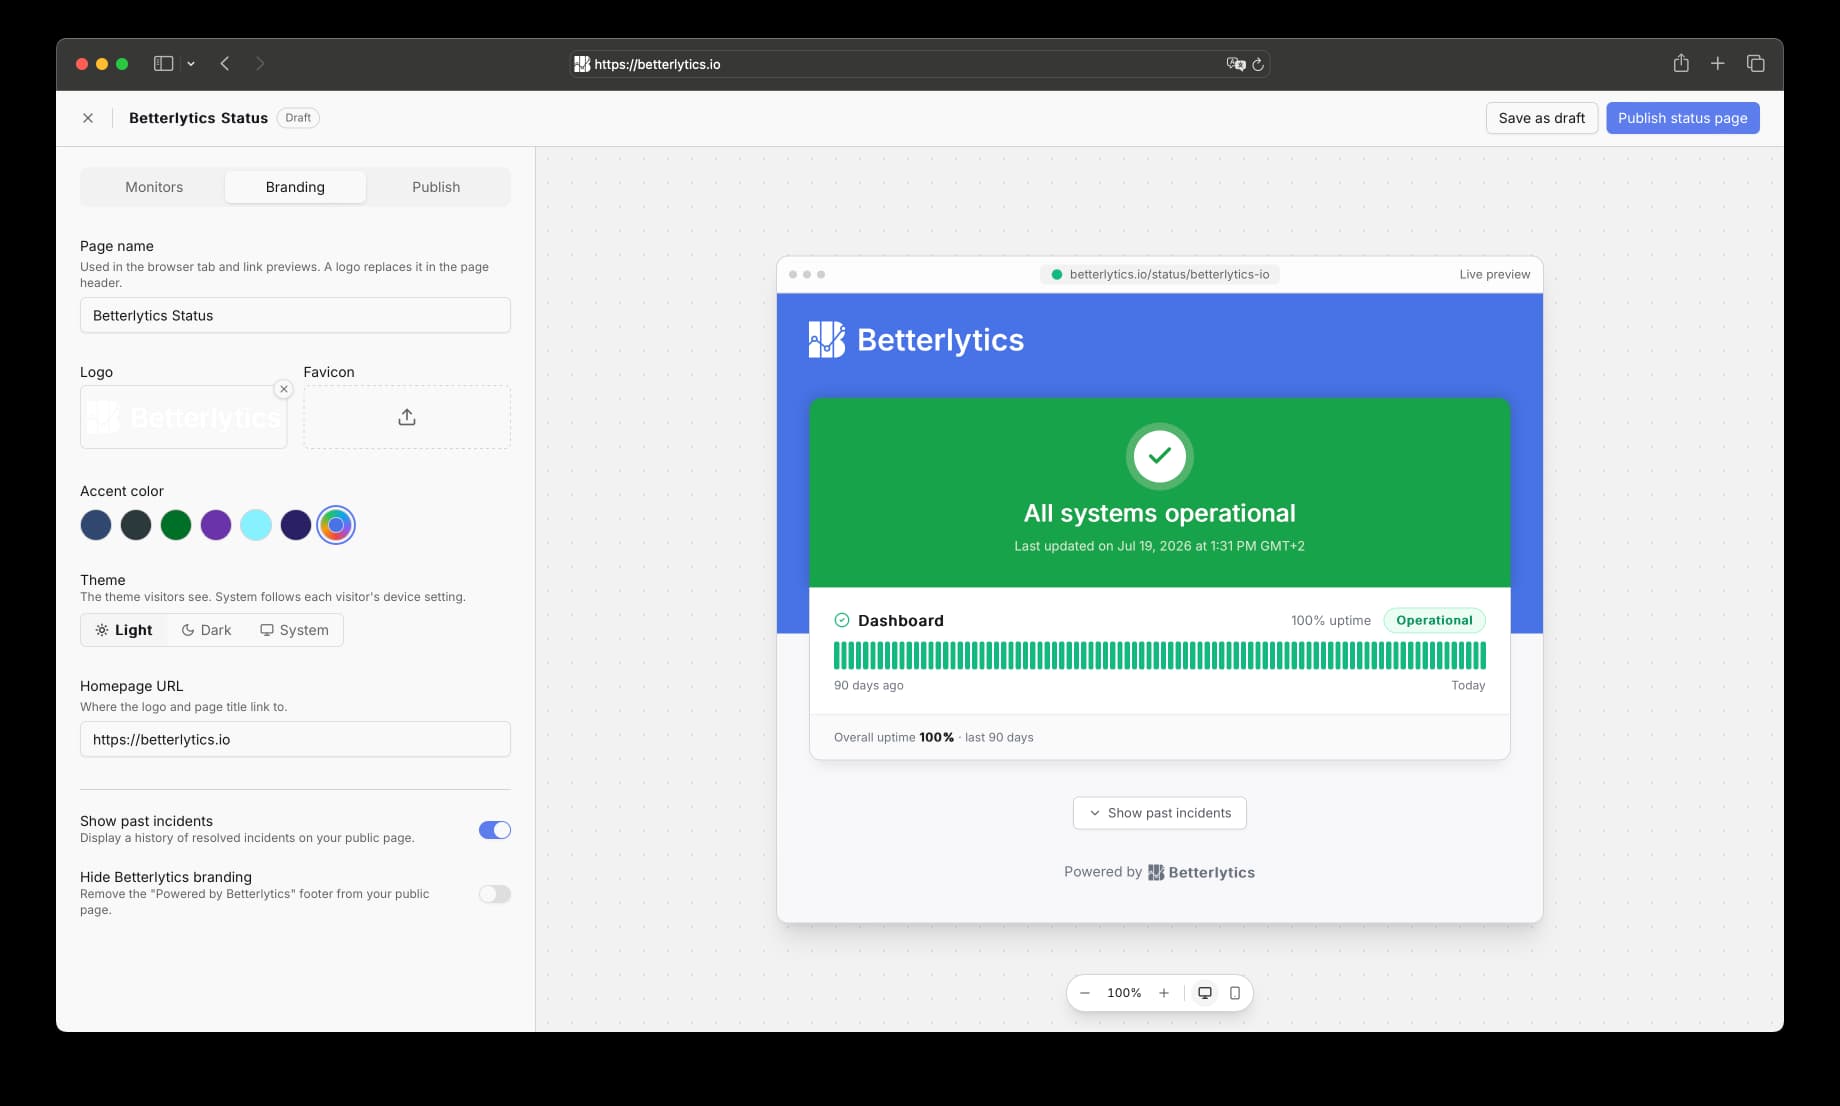
- The status page studio opens with a live preview of your page next to three editing tabs: Monitors, Branding, and Publish
- Add the monitors you want to display, adjust branding, and pick a URL
- Click Publish to make your page live and publicly accessible right away, or Save as draft to keep working on it privately
Choosing Monitors
The Monitors tab controls which services appear on your page:
- Add up to 20 monitors per status page
- Public display names: Each monitor gets a public name shown to visitors. Renaming a monitor here only changes what visitors see; the monitor keeps its internal name in your dashboard
- Drag to reorder: The order in the list is the order visitors see on the page
Give monitors visitor-friendly public names like “Website”, “API”, or “Dashboard” instead of internal names like prod-api-health-check. Your visitors don’t need to know your infrastructure naming.
Branding & Appearance
The Branding tab lets you make the page yours:
- Logo: Shown in the page header in place of the page name. PNG, JPEG, WebP, and SVG are supported
- Favicon: Shown in the browser tab. PNG, JPEG, or WebP. If you don’t upload one, the favicon is a colored dot reflecting your current overall status
- Accent color: Used for links and highlights throughout the page
- Theme: Light, Dark, or System (follows each visitor’s device setting)
- Homepage link: An optional URL that the logo and page title link to, typically your main website
- Show past incidents: Toggle whether resolved incidents from the last 90 days are listed on the page
- Remove Betterlytics branding: Hides the “Powered by Betterlytics” footer (Professional and Enterprise plans on Betterlytics Cloud, and every self-hosted instance)
Publishing & Visibility
Your Page’s URL
Every status page lives at:
https://betterlytics.io/status/{your-slug}On a self-hosted instance the page lives at https://<your-domain>/status/{your-slug} instead.
The slug is your page’s public address. It can contain lowercase letters, numbers, and hyphens, and must be unique across all Betterlytics status pages.
Want the page on your own domain instead, like status.example.com? See Custom Status Page Domain.
Draft vs. Published
A status page is only reachable once you publish it. Until then it exists as a draft that only your team can see in the studio preview. You can unpublish a live page at any time from Settings, which takes it offline immediately, and republish it later without losing anything.
Search Engine Visibility
The visibility setting controls whether search engines index your page. It is not access control:
- Public: Anyone with the link can view the page, and search engines are allowed to index it
- Unlisted: Anyone with the link can still view the page, but it is hidden from search engines
Note that neither option restricts access: every published page is viewable by anyone who has the link.
How Your Page’s Status Is Determined
The banner at the top of your status page always shows one of five states, from best to worst:
| Severity | Banner | Meaning |
|---|---|---|
| 1 | 🟢 All systems operational | Every monitor is healthy |
| 2 | 🟡 Degraded performance | Some services are slower than usual or showing warnings |
| 3 | 🟠 Some systems are down | One or more monitors are down, but not all |
| 4 | 🔴 Major outage | All monitors are down |
| N/A | ⚪ Status unavailable | No monitoring data yet (e.g. all monitors are paused or brand new) |
Two things feed into this status, and the more severe one always wins:
- Automatic monitor status: Your monitors’ live check results are rolled up automatically. All monitors down means Major outage, some down means Some systems are down, any monitor degraded means Degraded performance, otherwise All systems operational. This happens with no action from you.
- Published incidents: Each active incident you publish has an impact level (Degraded / Partial Outage / Major Outage). An active incident raises the page status to at least its impact level.
The key rule: incidents can only escalate the status, never soften it.
- If your monitors are healthy but you publish a Major Outage incident, the page shows Major outage
- If all your monitors are failing, the page shows Major outage even if you haven’t published any incident (or published one with a lower impact)
- Resolving an incident releases its escalation, and the page falls back to whatever your monitors currently report
This means visitors are never told everything is fine while checks are failing, and you can proactively warn about problems (e.g. a degraded third-party dependency) that your monitors can’t see.
What Visitors See
The public page is intentionally simple and fast: the status banner described above, a card per monitor with 90 days of daily uptime history, and your incident timeline. The easiest way to get a feel for it is to visit a live example: our own status page .
Visitors never see your internal monitor names, monitored URLs, raw check data, or who on your team authored an incident update.
Incidents
Incidents are how you communicate with your users during downtime: what’s happening, what’s affected, and how the investigation is progressing.
Incidents are always published by you. Nothing is posted publicly automatically. Monitor failures update the page’s status banner and uptime bars on their own, but an incident with a written timeline only appears when you create and publish it.
Detected Outage Suggestions
When your monitors detect an outage, it appears as a suggestion in the Incidents tab of your status page. Suggestions give you a one-click starting point:
- Outages that start around the same time across multiple monitors are grouped into a single suggestion
- Clicking Create incident pre-fills an incident draft from the detected outage
- You review and edit the draft before publishing. Suggestions never go public on their own
Creating an Incident
You can also create incidents manually at any time. An incident has:
- Title: What visitors see as the headline
- Impact: Degraded, Partial Outage, or Major Outage. This determines how the incident affects the page’s overall status (see How Your Page’s Status Is Determined)
- Affected monitors: Select the monitors involved. Leave it empty while you’re still investigating (“unspecified”), scope it to specific services, or mark it page-wide
Posting Updates
An incident’s lifecycle is driven by its timeline of updates: the incident’s current status is always whatever its most recent update says. Each update has:
- A status: Investigating, Identified, Monitoring, or Resolved
- An optional message. Status-only updates are fine
- A timestamp, which you can backdate if you’re writing up events after the fact
Posting a Resolved update resolves the incident and releases its effect on the page status. Updates can be edited, deleted, and reordered by adjusting their timestamps, so you can always clean up the record afterwards. Visitors see the timeline newest-first, with each status change and message.
A good incident timeline is short and honest: Investigating (“We’re looking into elevated error rates”), Identified (“A bad deploy has been rolled back”), Monitoring (“Error rates are back to normal, watching closely”), Resolved. You don’t need to write a novel. Timestamps do half the talking.
Incident History
Resolved incidents stay visible in the page’s past-incidents section for 90 days (if Show past incidents is enabled). You can also permanently delete incidents you don’t want in the record.
Checking Your Page with AI
Status pages are readable through the MCP server. Your AI assistant can see exactly what your page shows visitors right now, and tell you when a detected outage has no posted incident behind it.
"What does my status page show visitors right now?"
"Is there an ongoing outage I haven't posted an incident for?"
"Summarize the incidents currently published on my status page and their latest updates."
The MCP tools are read-only. As with the suggestions above, nothing is ever published on your behalf.
Roles & Permissions
What team members can do with status pages depends on their dashboard role:
| Action | Editor | Admin | Owner |
|---|---|---|---|
| Create and edit pages, manage incidents | ✓ | ✓ | ✓ |
| Publish and unpublish pages | ✗ | ✓ | ✓ |
| Delete pages | ✗ | ✓ | ✓ |
Deleting a Status Page
Deleting a status page is permanent: the page goes offline immediately and its incident history is removed. Your monitors and their check history are untouched. The page’s slug and custom domain become available for reuse.
If you just want the page offline temporarily, unpublish it instead.
Troubleshooting
My slug is taken
Slugs are globally unique across all Betterlytics status pages, and a set of reserved words (like admin, api, status) can’t be used. Try a variation like acme-status or status-acme.
If someone else has claimed a slug matching a brand or domain you own, contact support and we’ll help resolve it if you can verify ownership.
The page shows “Status unavailable” or gray bars
This means we have no monitoring data to display, typically because the page’s monitors are paused, were just created, or haven’t completed their first checks yet. Verify the monitors are active in Dashboard > Monitoring and give new monitors a few minutes. Days before a monitor existed show as gray “no data” bars and don’t count against your uptime percentage.
My changes aren’t showing on the public page
The public page caches data for up to 60 seconds. Wait a minute and refresh. Also check that you clicked Publish, since changes saved as a draft aren’t public.
Why is the page in English?
Public status pages are currently English-only, regardless of the visitor’s language, to keep incident communication unambiguous. Your own incident titles and update messages can of course be written in any language.
Related: Set up Uptime Monitoring to power your status page, host it on your own domain with a Custom Status Page Domain, or compare pricing plans for status page limits.