Error Tracking in Your Dashboard
Error Tracking captures JavaScript errors on your site and groups identical ones together, so you can see which issues affect the most users, inspect where they occurred, and watch a session replay to understand what happened.
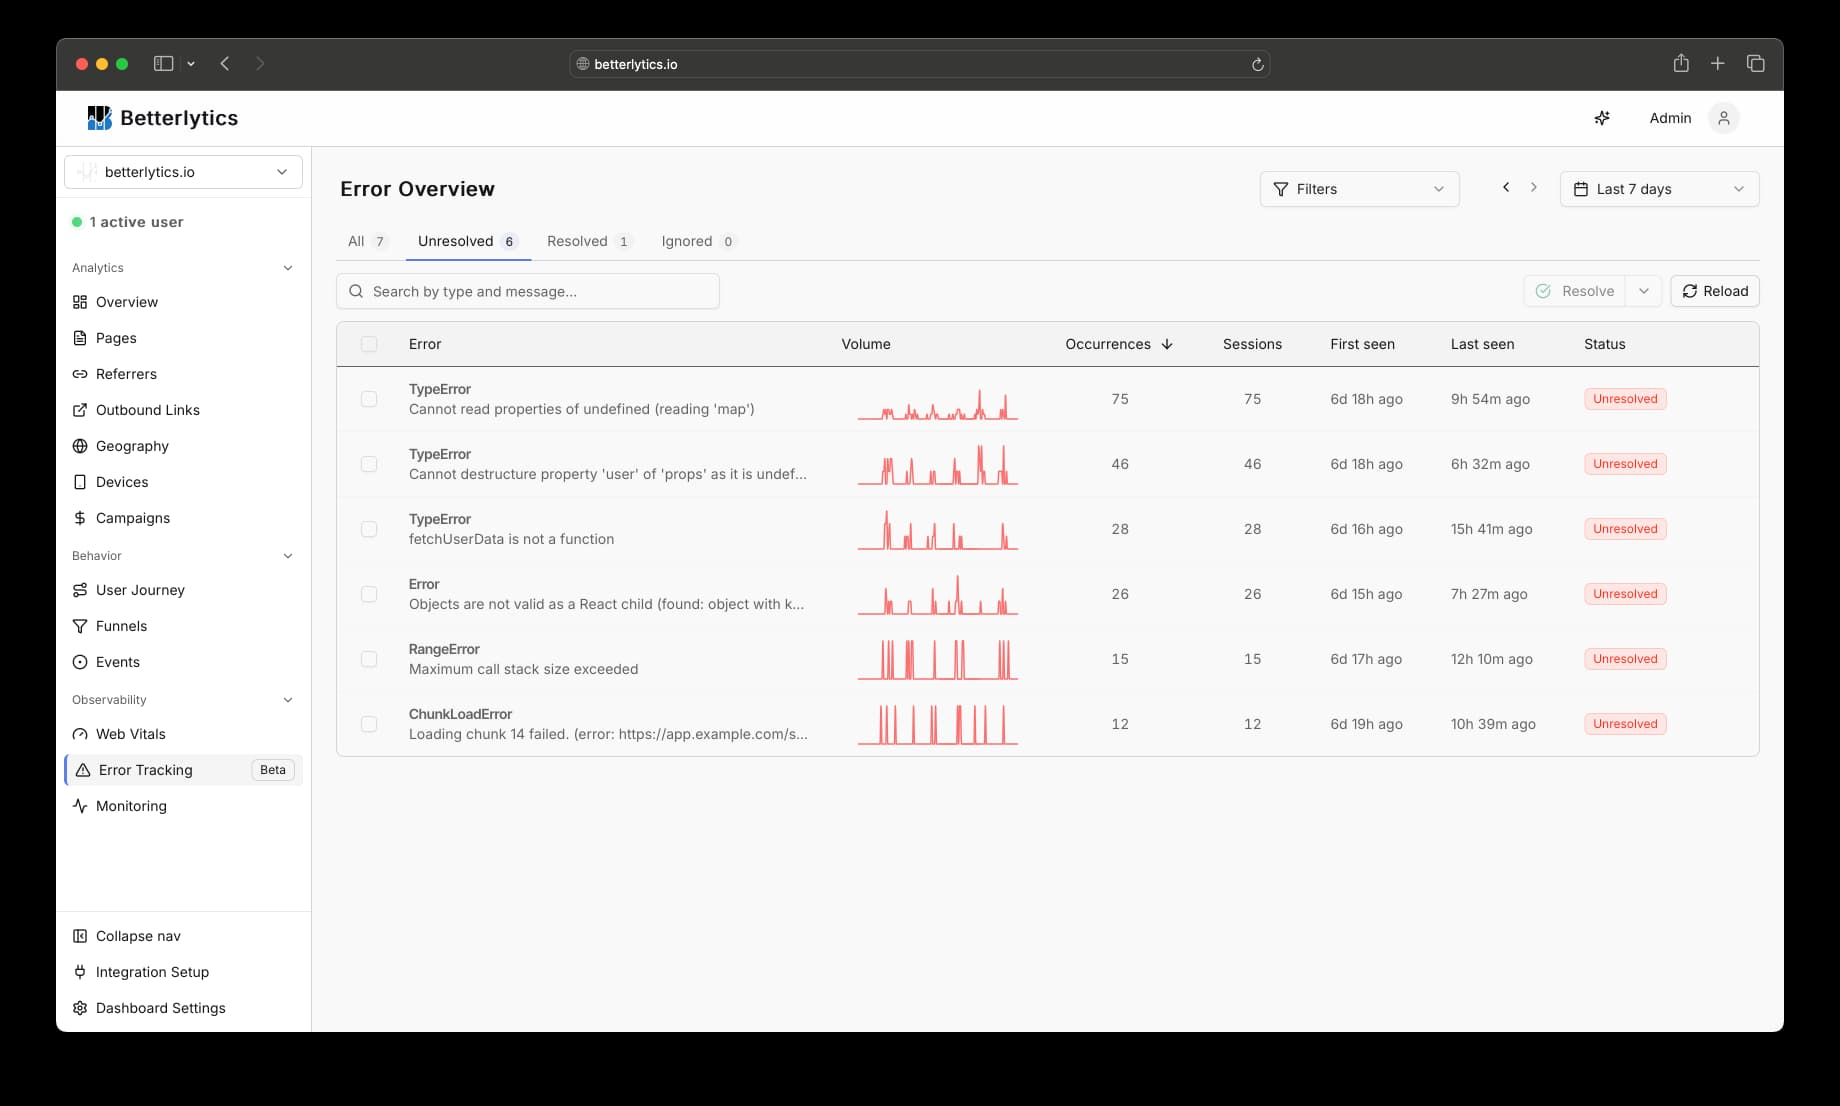
Go to Dashboard > Errors to see all error groups detected for the selected time range.
Error tracking must be enabled in your tracking script. See the Error Tracking integration guide for setup instructions. Error Tracking is live on Betterlytics Cloud and not yet included in the self-hosted image. See feature availability.
Status management
Each error group has one of three statuses: Unresolved, Resolved, or Ignored. Use the filter tabs at the top to show only the errors you care about. You can update the status per error or select multiple and apply a bulk change.
Error detail page
Selecting an error group opens a detail view with a full breakdown: when it first appeared, how often it occurs, which browsers and devices are affected, and a stack trace for each occurrence.
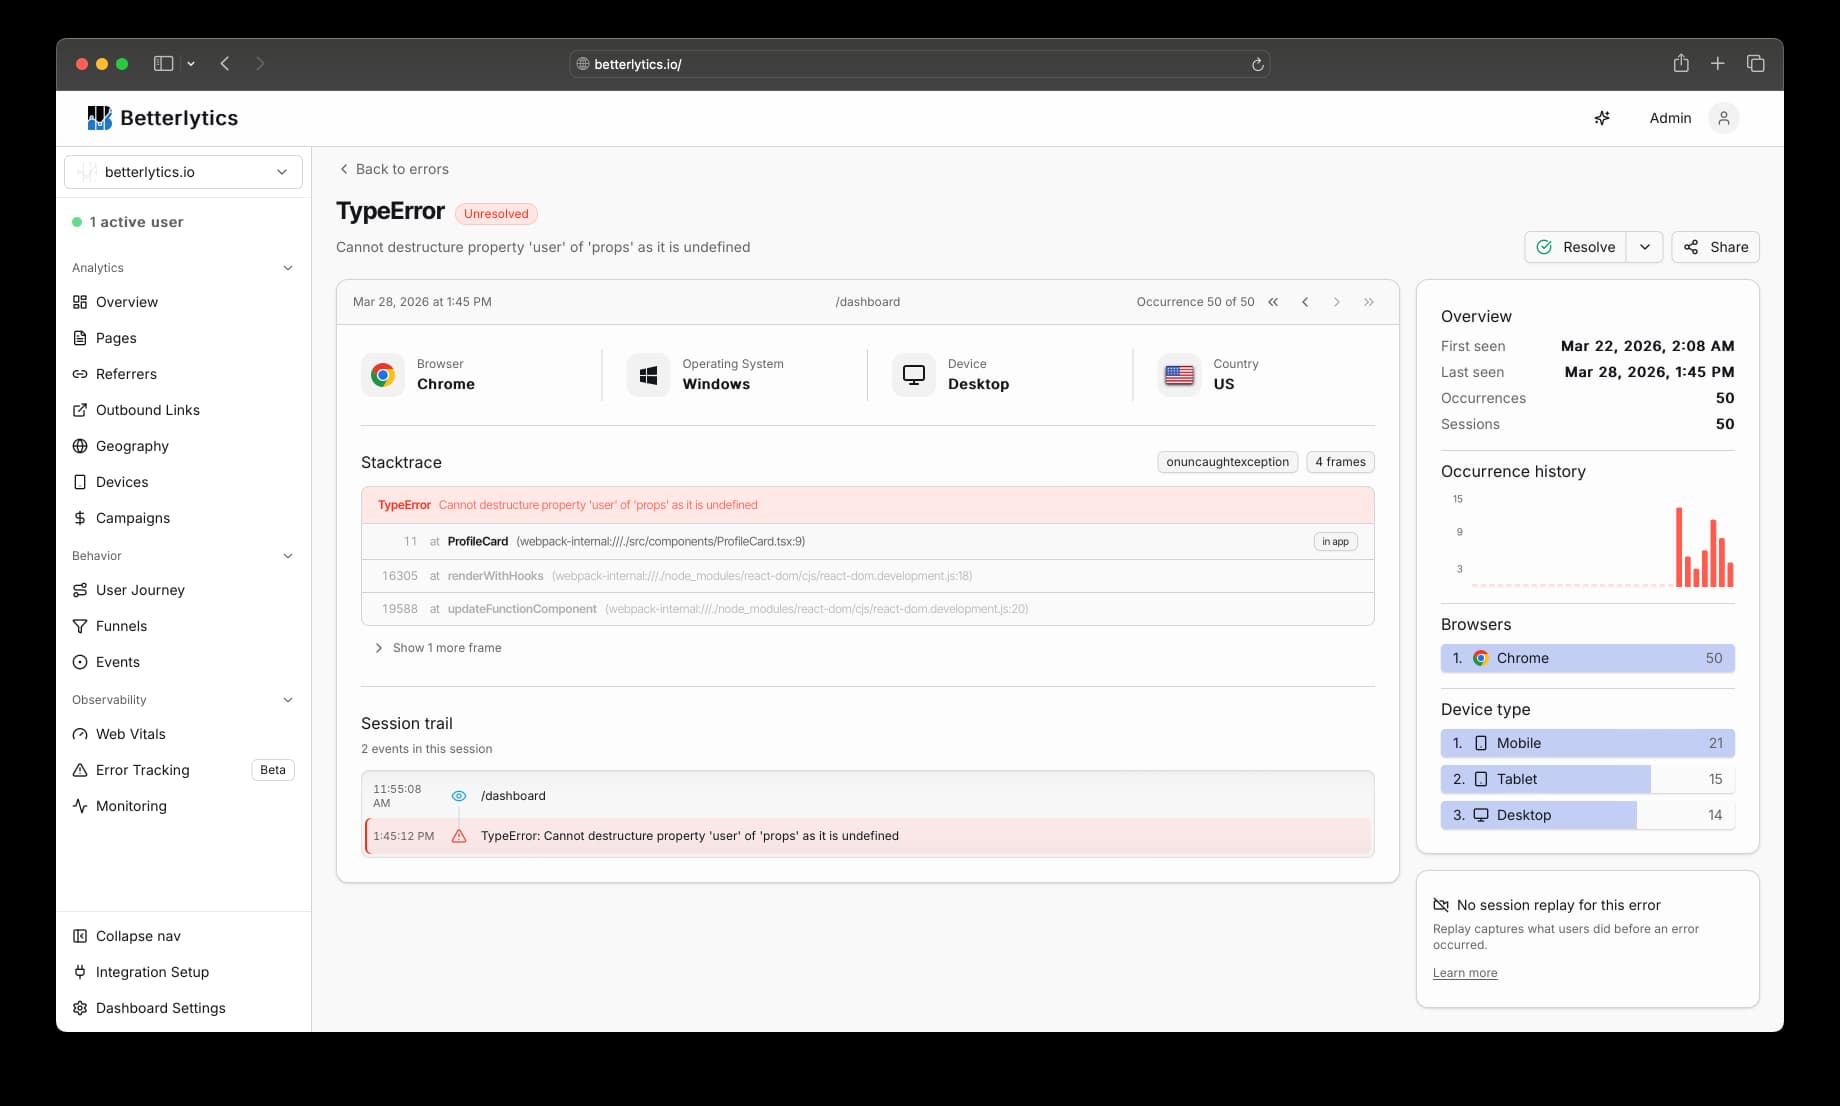
Stack trace
The stack trace shows where the error happened in your code. Frames from your own code are highlighted separately from third-party libraries.
Session trail
The session trail shows everything that happened in the user’s session before the error: pageviews, custom events, outbound link clicks, and other errors. It helps you understand what led to the problem.
Session replay
For recorded sessions, a Watch session replay link appears on the detail page. It takes you directly to the moment the error occurred so you can see the full user experience, not just the stack trace.
Replay links are available when Session Replay is enabled and the session was recorded, either through regular sampling or error-triggered recording.
Debugging with AI
Errors are available through the MCP server. You can ask your AI assistant to list errors, inspect stack traces, and walk through the session trail - without leaving your editor.
"What are the top errors on my site today?"
"Show me the stack trace for the TypeError affecting the most users."
"Where in my code is this error occurring?"
"What was the user doing before this error? Walk me through the session trail."
Troubleshooting
- No errors appearing: Verify error tracking is enabled in your tracking script. See the integration guide for setup instructions.
- Too many errors: Browser extension errors are filtered out automatically. Use the Ignored status to suppress known issues.
- Missing stack traces: If you only see
"Script error.", your scripts are likely served from a different domain. See the integration guide for how to fix this. - No session replay link: The session needs to have been recorded. See the integration guide for how to enable error-triggered recording.
Related: Learn how to enable and configure Error Tracking.