Uptime Monitoring & SSL Certificate Checks
Betterlytics includes built-in uptime monitoring and SSL certificate checks that continuously verify your website’s availability and alert you when something goes wrong. No additional tools or integrations are required, monitoring is built directly into your analytics dashboard.
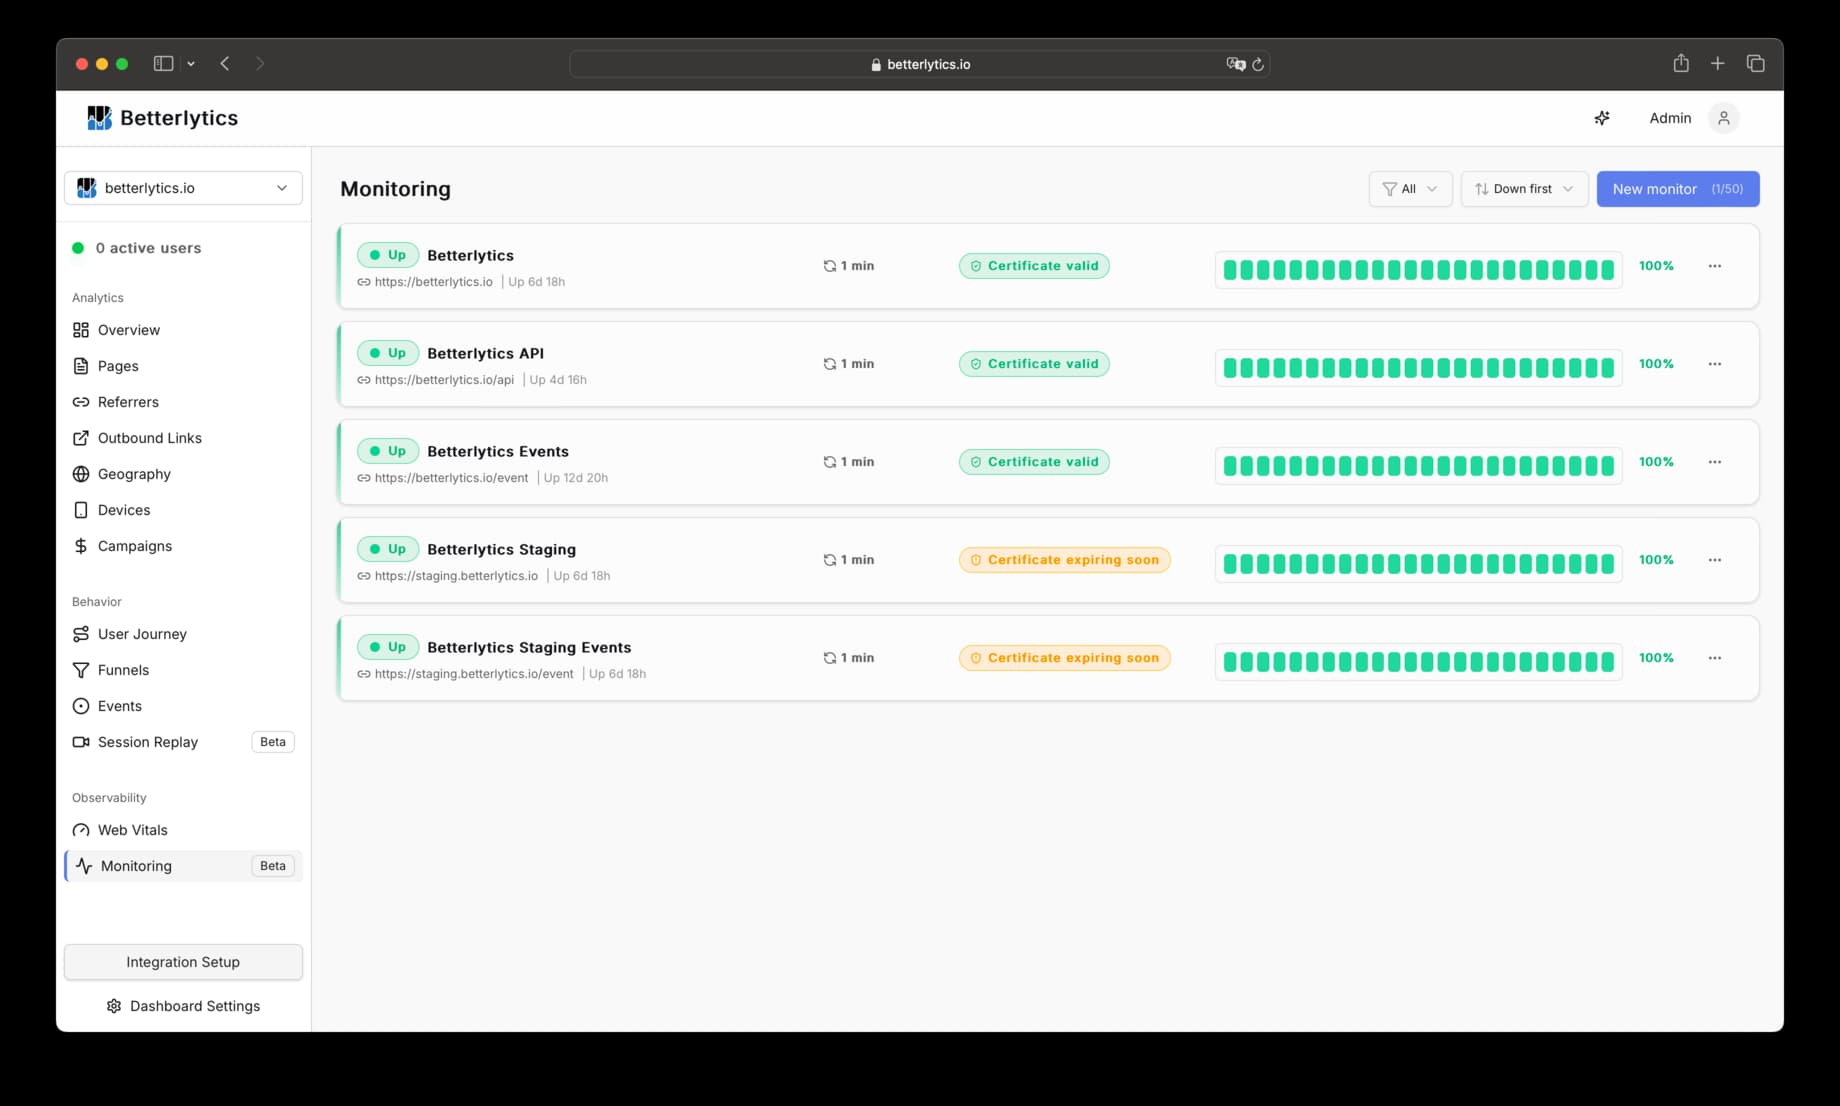
What We Monitor
Each monitor performs HTTP checks on your configured URL and tracks:
- Uptime status: Whether your site is responding successfully
- Response time (latency): How long it takes your server to respond
- SSL certificate health: Expiration date and certificate validity
- Incident history: Timeline of downtime events and their causes
Uptime monitoring continuously checks whether your website or API endpoints are reachable and responding correctly over time.
Creating a Monitor
- Navigate to Dashboard > Monitoring
- Click Create Monitor
- Enter the URL you want to monitor (must be on your dashboard’s domain)
- Configure timing, alerts, and advanced settings
- Click Create
Monitors can only target URLs within your dashboard’s registered domain. For example, if your dashboard is for example.com, you can monitor https://example.com/api/health, https://api.example.com, or any subdomain.
Monitor Limits
The number of monitors you can create depends on your plan:
| Plan | Monitor Limit |
|---|---|
| Growth | 5 monitors |
| Professional | 50 monitors |
| Enterprise | Unlimited |
Configuration Options
Timing & Sensitivity
Check Interval
How often we check your site. Available options range from 1 minute to 24 hours.
- Recommended: 5 minutes for most websites
- Critical endpoints: 1 minute for mission-critical services where fast detection is essential
- Shorter intervals: Faster detection and more responsive alerts
- Longer intervals: Suitable for non-critical or low-priority endpoints
Check intervals under 5 minutes are available on Professional and Enterprise plans.
Request Timeout
How long we wait for a response before marking the check as failed. Range: 1 second to 30 seconds.
- Recommended: 3 seconds for most sites
- Increase if your server has slower cold starts or processing time
- Decrease for faster detection of hanging requests
Failure Threshold (Sensitivity)
How many consecutive failures are required before we open an incident and send alerts. Range: 1 to 10 checks.
- Threshold of 1: Most sensitive. Alerts on the first failure. May cause false alarms from transient network issues.
- Threshold of 3 (recommended): Balances responsiveness with reliability. Waits for 3 consecutive failures before alerting.
- Higher thresholds: More tolerant of brief issues, but slower to alert on real outages.
The failure threshold only controls when a new incident is opened. Once an incident is open, it stays open until recovery. We don’t require the threshold to be met again for subsequent failures.
Calculating Alert Timing
To understand when you’ll receive an alert after downtime begins, multiply your check interval by your failure threshold.
Examples:
- 1-minute interval + threshold of 2 = Alert sent 2 minutes after downtime starts (at earliest)
- 5-minute interval + threshold of 3 = Alert sent 15 minutes after downtime starts (at earliest)
- 1-minute interval + threshold of 1 = Alert sent 1 minute after downtime starts (at earliest)
This helps you balance between fast alerts (lower values) and avoiding false alarms from transient issues (higher values).
Email Alerts
Alerts are sent to the dashboard owner’s email address.
Want alerts in Slack, Discord, Teams, or on your phone? Set up notifications to receive monitoring alerts in the tools you already use.
Alert Types
- Down alerts: Sent when the failure threshold is reached and an incident opens
- Recovery alerts: Sent when the site comes back online after an incident
- SSL expiry alerts: Sent when your certificate is approaching expiration
You can enable or disable each alert type independently.
SSL Certificate Monitoring
For HTTPS URLs, we automatically monitor SSL certificate health.
What We Check
- Certificate validity and trust chain
- Expiration date
- Hostname matching
- Common SSL/TLS errors
SSL Expiry Alerts
Configure how many days before expiration you want to start receiving reminders. Options: 1, 3, 7, 14, or 30 days.
- Recommended: 14 days gives you time to renew before issues occur
- You’ll receive reminders at key milestones (e.g., if set to 14 days: at 14, 7, 3, and 1 day before expiry)
- Each milestone triggers only one alert. You won’t receive daily reminder spam.
SSL monitoring is only available for HTTPS URLs. For HTTP URLs, this setting has no effect.
Advanced Configurations
These options are available on Professional and Enterprise plans.
HTTP Method
Choose between HEAD (default) or GET requests.
- HEAD: Faster, checks availability without downloading the full response body
- GET: Downloads the full response. Required for keyword validation, or if your server doesn’t support HEAD requests
Expected Keyword
When using the GET method, you can optionally specify a keyword or phrase that must be present in the response body. If the keyword is not found, the check is marked as failed; even if the HTTP status code is healthy.
This catches scenarios where a page returns 200 OK but serves broken content, a maintenance page, or an error message.
How it works:
- The keyword is matched against the raw HTML source code (first 32 KB of the response)
- Matching is case-sensitive
- The response is assumed to be UTF-8 encoded. Non-UTF-8 content may not match as expected
- Maximum keyword length: 256 characters
Tips for choosing a keyword:
- Use text that appears directly in your HTML source, such as your site title, a
<meta>description, or a footer tagline - Avoid text that spans across HTML tags. For example, if your HTML is
<h1>Welcome to <span>My Site</span></h1>, useWelcome toorMy Site, notWelcome to My Site - Avoid content that is rendered by JavaScript (e.g., React components that only appear after hydration). The monitoring system fetches raw HTML without executing JavaScript
To verify what text is available for matching, run curl -s https://your-site.com | head -c 32768 in your terminal. The output is exactly what the monitor sees.
Custom Request Headers
Add up to 10 custom headers to your monitoring requests. Useful for:
- Authentication tokens
- Custom user-agent strings
- API versioning headers
- Any header your endpoint requires
Security-sensitive headers (like Host, Content-Length, etc.) cannot be overridden.
Accepted Status Codes
By default, we consider any 2xx response as healthy. You can customize this to accept:
- Specific codes (e.g.,
200,201,204) - Code ranges (e.g.,
2xx,3xx) - Up to 5 accepted codes/ranges
This is useful if your health endpoint returns a non-2xx code intentionally.
Understanding Monitor Status
Monitors can be in one of these states:
| State | Meaning |
|---|---|
| Up | Monitor is healthy. All recent checks succeeded. |
| Down | An incident is in progress. The site is failing checks. |
| Degraded | The site is responding but with warnings (e.g., slow responses, SSL issues). |
| Preparing | Monitor was just created. Waiting for the first check to complete. |
| Paused | Monitor is disabled. No checks are being performed. |
How Incidents Work
An incident represents a period of downtime or degraded service.
When Incidents Open
An incident opens when:
- A check fails (timeout, error response, SSL error, etc.)
- The failure repeats for N consecutive checks, where N is your failure threshold
At this point:
- The monitor status changes to Down
- A Down alert email is sent (if enabled)
- The incident start time is recorded
When Incidents Close
An incident closes when your site starts responding successfully again. We wait for a few consecutive successful checks to confirm the issue is truly resolved before sending the recovery alert. This prevents false “all clear” notifications from a single lucky request.
At recovery:
- The monitor status changes to Up
- A Recovery alert email is sent (if enabled)
- The incident is marked as resolved
Example
- 12:00: First failed check
- 12:05: Second failed check
- 12:10: Third failed check → Incident opens (threshold = 3)
- 12:15: Site recovers
- 12:20: Recovery confirmed → Incident closes
Metrics & Dashboard
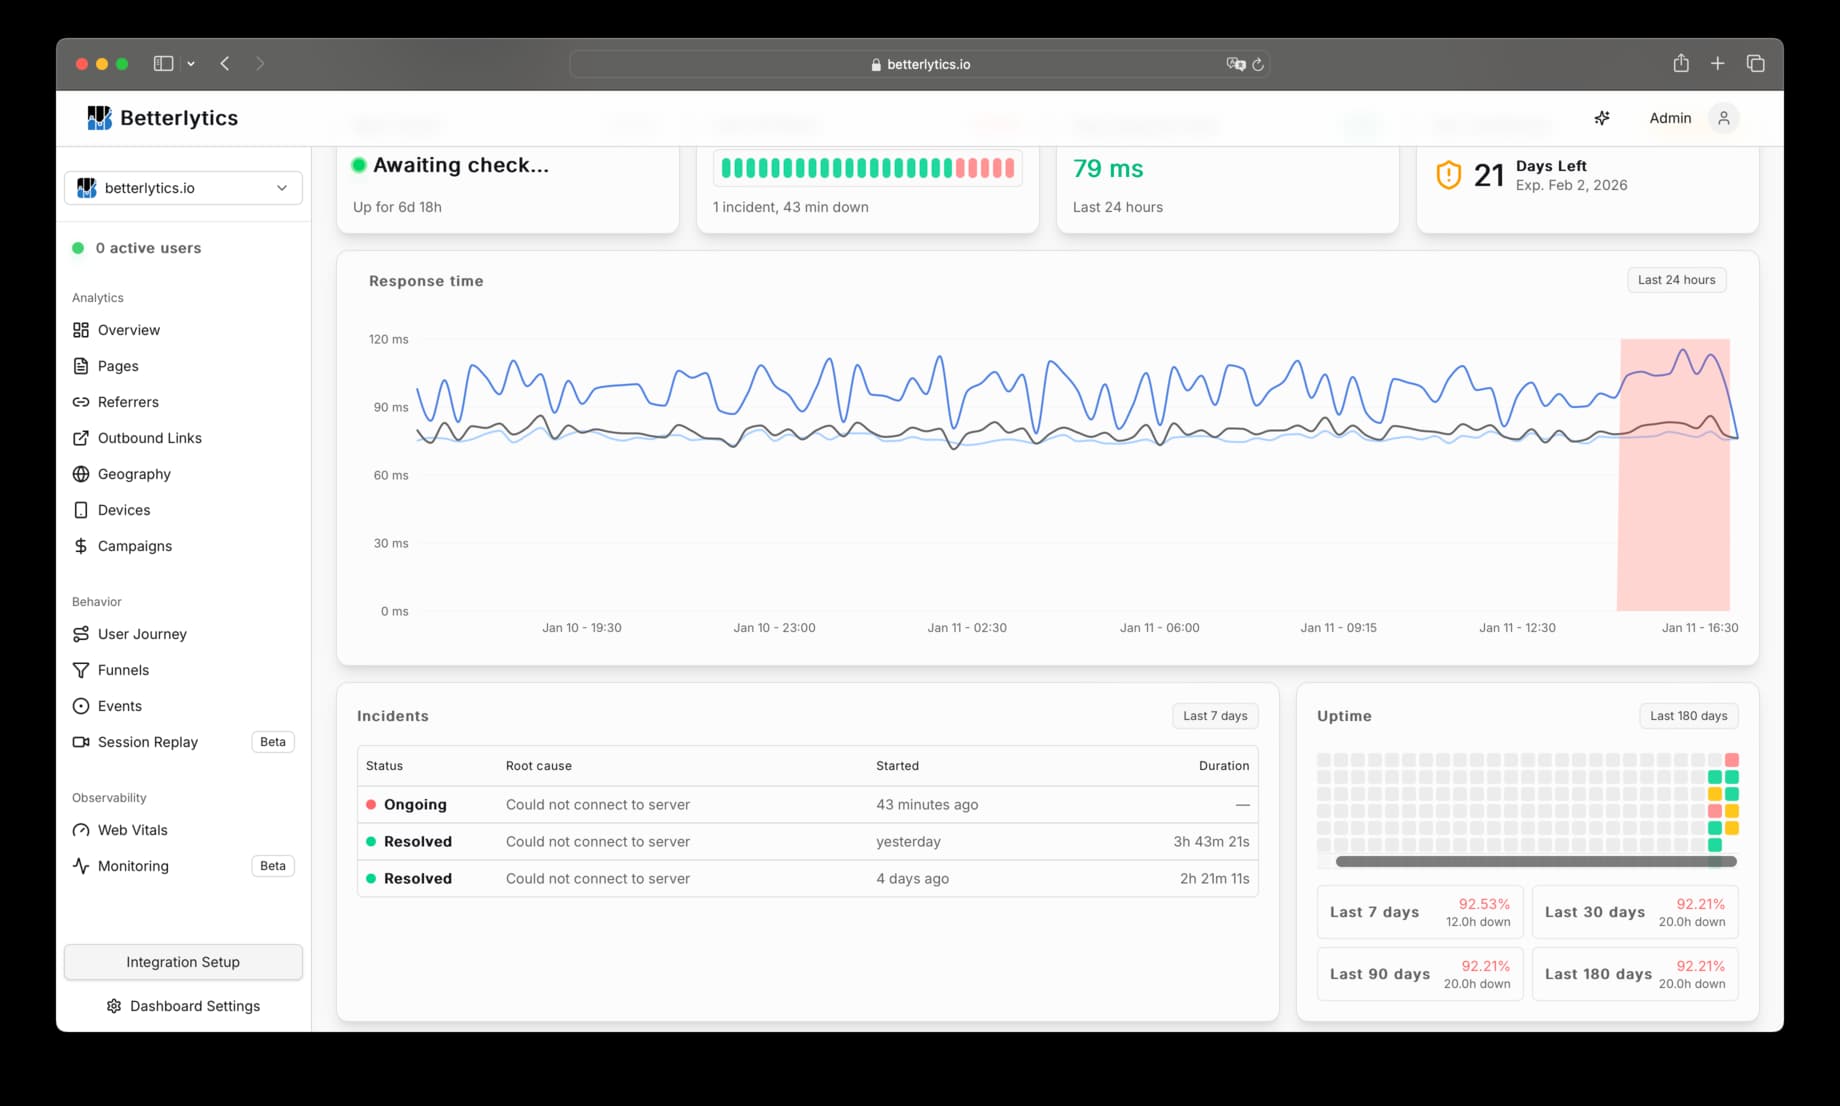
24-Hour View
The monitor detail page shows:
- Uptime percentage: Calculated from actual check results
- Response time chart: P50, P95, and average latency over time, along with incident periods
- Uptime grid: Visual indicator of hourly uptime over the last 24 hours
- Incident table: Recent incidents with status, cause, start time, and duration
Recent Checks
View the most recent check results including:
- Timestamp
- Status (OK, Warning, Failed)
- Response time
- HTTP status code
- Failure reason (if applicable)
You can filter to show only errors for quick debugging.
Daily Uptime (180 Days)
A calendar-style grid showing daily uptime percentages. Hover over any day to see the exact percentage.
SSL Certificate Details
For HTTPS monitors, the detail page shows:
- Certificate status: Valid, Expiring Soon, Expired, or Error
- Days until expiration
- Expiry date
- Last SSL check result
Checking Uptime with AI
Monitors and their incidents are available through the MCP server. You can ask your AI assistant whether your site is up, or have your coding agent check for outages before it starts digging into a bug report.
"Are all my monitors up right now?"
"What outages did we have this week, and how long did each one last?"
"What's the uptime percentage for my API health check over the last 28 days?"
"Are any of my SSL certificates expiring soon?"
Pausing and Deleting Monitors
Pausing
You can pause a monitor temporarily to stop checks without deleting configuration. This is useful during:
- Planned maintenance
- Site migrations
- Temporary shutdowns
Deleting
Deleting a monitor removes all configuration. Historical check data is retained for your analytics records.
Troubleshooting
No Checks Appearing
- Ensure the monitor is not paused
- Wait a few minutes for the first check to complete
- Verify the URL is reachable from the public internet
False Positives / Too Many Alerts
- Increase the failure threshold to 3 or higher
- Increase the request timeout if your server is slow
SSL Monitoring Not Working
- Ensure the URL uses
https:// - Verify “Check SSL Errors” is enabled in Advanced Settings
Keyword Not Found (but the page looks fine)
- The keyword is matched against raw HTML, not rendered text. View your page source to confirm the keyword exists as a continuous string
- If your site uses client-side rendering (React, Vue, etc.), the keyword may only exist after JavaScript runs. Choose a keyword from the server-rendered HTML instead
- Check that HTML tags don’t split your keyword. For example,
<b>Hello</b> Worldwon’t matchHello Worldas a single string - The monitor only checks the first 32 KB of the response. If your keyword appears later in the page, it may not be reached
- The response is assumed to be UTF-8 encoded. If your site uses a different encoding (e.g. ISO-8859-1), keywords with special characters may not match
Check Interval Changed Unexpectedly
If you see a different interval than what you configured, automatic backoff may be active. When a monitor fails repeatedly for an extended period, we reduce the check frequency to conserve resources. The interval will return to normal automatically once your site is consistently responding.
Related: Share your uptime publicly with a Status Page, or compare pricing plans to see monitor limits and advanced features.