Referrer Analytics
The Referrers page provides comprehensive insights into where your website visitors come from. Understanding your traffic sources helps you optimize marketing campaigns, identify successful channels, and make data-driven decisions about where to focus your promotional efforts.
Accessing Referrer Analytics
Navigate to Dashboard > Referrers to view your referrer analytics data.
What Referrer Analytics Shows
The referrers page displays referral sessions (not individual page views) from external sources, giving you insight into how visitors discover your website. Each referral session represents a unique visitor session that originated from an external source during your selected time period.
Referrer analytics shows referral sessions - meaning unique visitor sessions from external sources. Internal navigation between pages on your site is filtered out to focus on true traffic acquisition.
Overview Summary Cards
The top of the page displays four key metrics that provide a quick overview of your referral traffic:

Referral Summary Metrics
- Referral Sessions - Total number of sessions that came from external sources
- Referral Traffic % - Percentage of all sessions that originated from external referrers
- Top Referrer Source - The most frequent source category (search, social, etc.)
- Avg. Session Duration - Average time visitors spend when arriving from external sources
Charts Section
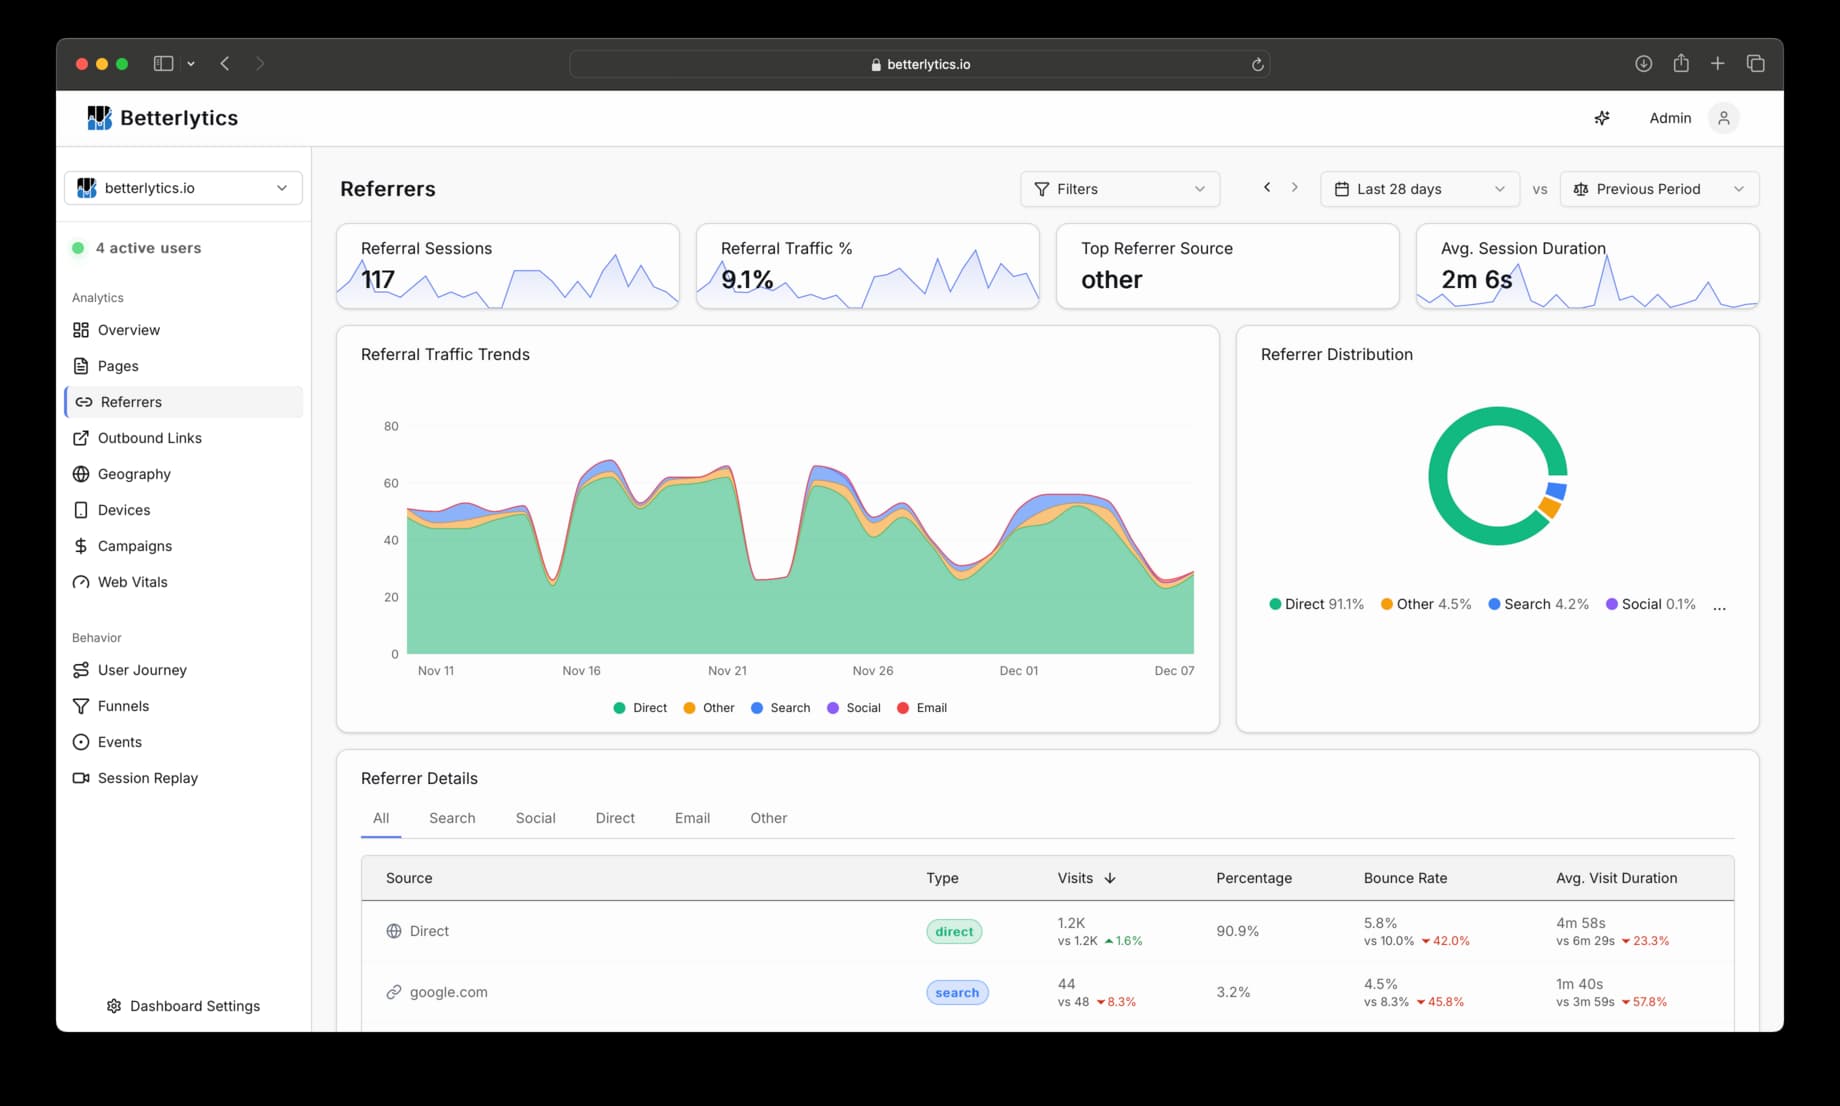
Referrer Distribution
What it shows: A pie chart displaying the breakdown of referral sessions by source category.
Source Categories:
- Search - Search engines like Google, Bing, DuckDuckGo
- Social - Social media platforms like Facebook, Twitter, LinkedIn
- Direct - Visitors who typed your URL directly or used bookmarks
- Email - Traffic from email campaigns and newsletters
- Other - External websites and sources not in the above categories
Referral Traffic Trends
What it shows: A stacked area chart showing how referral traffic from different sources changes over time.
Features:
- Stacked areas represent different source types with distinct colors
- Time-based trends help identify seasonal patterns or campaign effectiveness
- Comparison support to see changes from previous periods
- Interactive legend to focus on specific traffic sources
Detailed Referrer Table

Tabbed View
The referrer table is organized into tabs for easy analysis:
Available Tabs:
- All - Complete view of all external referrers
- Search - Only search engine traffic
- Social - Only social media traffic
- Direct - Only direct traffic
- Email - Only email campaign traffic
- Other - All other external sources
Table Columns
What each column displays:
- Source - The actual website or URL that referred the visitor
- Type - Category badge (Search, Social, Direct, Email, Other)
- Visits - Number of referral sessions from this source
- Percentage - Share of total referral traffic
- Bounce Rate - Percentage of single-page sessions from this source
- Avg. Visit Duration - Average time visitors from this source spend on your site
Understanding Referrer Sources
Direct Traffic
What counts as Direct:
- Typed URLs directly into the browser
- Bookmarked pages
- Links from apps that don’t pass referrer information
- HTTPS to HTTP transitions (referrer stripped for security)
Direct Traffic Note: Some traffic marked as “direct” may actually come from other sources due to privacy settings, mobile apps, or security policies that strip referrer information.
Dashboard Filters
Referrer analytics respects all dashboard filters for detailed analysis:
- Time Range - Compare referrer patterns across different periods
- Query Filters - Segment referrer data by geography, device type, or custom criteria
- Comparison Periods - See how your referral sources have changed over time
Best Practices
Regular Monitoring
- Weekly source reviews - Track changes in your top referral sources
- Campaign correlation - Connect referral spikes to marketing activities
- Seasonal analysis - Identify patterns related to industry cycles or events
Optimization Strategies
- Double down on winners - Invest more in high-performing referral sources
- Investigate anomalies - Research unexpected traffic sources for new opportunities
- Improve weak performers - Optimize underperforming channels or consider reallocating resources
Privacy and Data Considerations
Important Considerations:
- Referrer policies - Some browsers and sites limit referrer information for privacy
- HTTPS transitions - Referrer data may be stripped when moving from HTTPS to HTTP
- Mobile apps - Traffic from mobile applications often appears as direct
- Privacy tools - Ad blockers and privacy browsers may affect referrer accuracy
- Search privacy - Some search engines limit or encrypt search term data
Quick Analysis Questions
Key Questions to Ask:
- Are your top referral sources aligned with your marketing efforts? - Verify that your investments are paying off
- Which sources have the highest engagement? - Look at session duration and bounce rates by source
- Are there unexpected referral sources? - Investigate new opportunities or potential issues
- How do referral sources correlate with conversions? - Analyze which sources drive valuable actions
- What’s your search vs. social vs. direct traffic balance? - Understand your traffic acquisition mix
Questions about referrer analytics? Join our Discord community for help!