Most product teams now run four or five different SaaS tools to understand what their users are doing on their site. One for analytics. One for errors. One for uptime. One for session replay. One for performance. None of them know about each other.
We were one of those teams, building a Vendor Management System, until we got tired of it and built the dashboard we wished existed. This post is the long version of who we are, what we built, and why we keep betting on consolidation instead of depth in any one category.
Key Takeaways
- One dashboard for what most teams currently use four to five separate tools to do.
- Covers analytics, session replay, errors, uptime, Core Web Vitals, plus AI agent access via MCP.
- Built by a small team that got tired of juggling SaaS dashboards on their own product.
- Cookieless, EU-hosted, open source under AGPL-3.0. Defaults from consolidation, not the pitch.
- For teams currently paying for multiple separate observability tools.
What is Betterlytics?
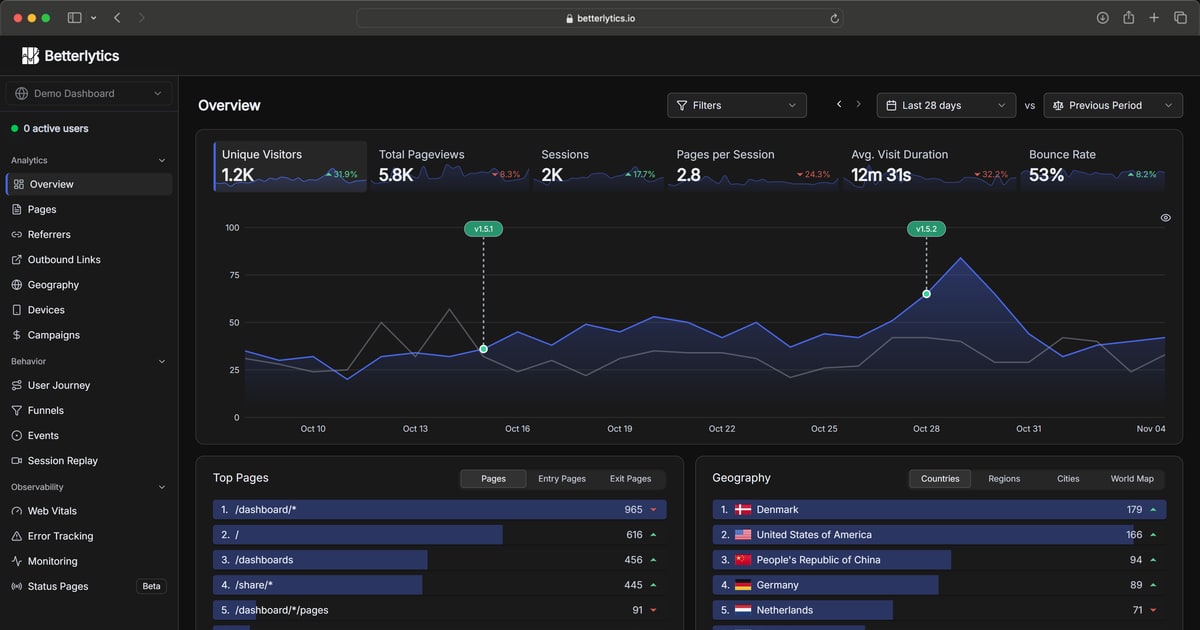
Betterlytics is one dashboard for the signals that tell you what is happening on your site: traffic, behavior, errors, uptime, performance, and session replay. It runs on Rust and ClickHouse, is open source under AGPL-3.0, and ships a single tracking script of about 3.5 KB. Everything is in one product, on one page.
Most teams currently stitch this together from four or five separate SaaS products. We thought it would be more useful if all of those signals lived in the same place, queryable against each other. So we built that.
| Signal | What teams usually do | Betterlytics |
|---|---|---|
| Web analytics (pageviews, sessions, funnels, journeys) | Pay for an analytics SaaS | Built in |
| Error tracking | Pay for an error tracker | Built in |
| Uptime and SSL monitoring | Pay for a monitoring service | Built in |
| Session replay | Pay for a replay tool | Built in |
| Core Web Vitals (LCP, INP, CLS, TTFB) | Pay for a performance monitor | Built in |
| AI agent access to the data | Usually unavailable | Yes, via MCP |
The afternoon we counted the tools
We had a small whiteboard at one point with everything we were paying for to understand a single user session on the product we were building. It read like a checklist for a much bigger company: an analytics tool, an error tracker, an uptime monitor, a session replay product, and a performance monitor. Five subscription lines. Five dashboards. Five different definitions of a "session."
Each of those tools, taken alone, was good at the thing it did. But the experience of using all five together was somewhere between exhausting and pointless. When a customer reported a bug, we would jump from the error tracker to the analytics dashboard to the replay tool. The tools did not know about each other. We were the integration layer, in our heads, manually correlating timestamps and user IDs.
That was the afternoon we decided the shape of the problem was wrong. We did not want five better tools. We wanted one dashboard where the signals lived together, queried each other, and showed up on the same timeline. So we stopped paying for our toolbelt and started building it.
Betterlytics began as that product. It is now the version we ship for everyone else.
Why should a dashboard mean every signal, at every depth?
A dashboard is supposed to show you what is happening, not just one slice of it. Somewhere in the last decade, the term shrank. An analytics dashboard came to mean pageviews. An errors dashboard came to mean stack traces. We think the original meaning was more useful, and we are building toward it.
The split was probably an accident of market timing. Each category got its own startup. Each startup got its own funding round. Each grew up convinced that "depth in one signal" was a better business than "breadth across all of them." That is fine as a business decision. It is bad as a user experience.
The user, in this case, is a small product team trying to answer a question about their site. The question is rarely "show me pageviews." It is more often "why did conversion drop on Tuesday?" Answering that genuinely takes three or four signals at once: traffic, errors, performance, and replay if you have it. A dashboard that only shows you one of those is not a dashboard. It is a chart.
Depth is the other half. A consolidated dashboard is not useful if it only gives you the summary. You need to drill in. Click a slow page, see its Core Web Vitals breakdown. Click an error spike, see what users were doing in the minute before the crash. Click a conversion funnel drop, watch a session replay of someone who left.
The shallow version of "all in one" is five small graphs on one page. The useful version is five connected lenses on the same underlying data. That is the version we are building toward. Not every drill-through is there yet, but the data model is one model, and that is the part that has to be right first.
The defaults you get when you build one tool instead of five
When you decide to build one product instead of five, you get to make some defaults that the specialists cannot easily make. We picked a few.
Cookieless tracking. The analytics, replay, error, and performance signals all share one tracker. That tracker does not need a persistent identifier, so we left cookies out entirely. Nothing is stored on your visitors' devices for analytics, errors, or performance. That removes the usual reason for a cookie banner. Session replay is the exception and only runs once your site records consent. How we count visitors without cookies shows exactly what the tracker does.
EU hosting. Because every category runs on the same infrastructure, all of it stays in the EU: analytics, errors and uptime on our servers in Germany, and session replays in Cloudflare R2's EU region. Most stacks of specialist tools end up touching three or four regions in practice.
Open source under AGPL-3.0. A specialist tool published as open source is useful. An all-in-one tool published as open source is a different proposition. You can run a meaningful part of your observability stack on your own hardware. The full source is on GitHub.
None of these are the reason we built Betterlytics. They are defaults we could pick because building one product instead of five made them affordable.
What does an all-in-one tool cost you?
The honest answer: depth in any single category. A team that has used a dedicated session replay product for three years will find ours simpler. A team migrating from a mature error tracker will miss some of the power-user features. We do not pretend otherwise.
Our argument: for most product teams, having every signal in one place is worth more than the deepest features of any one specialist. Each tool's depth has a long tail, and most teams use a small fraction of it.
The bet may not be right for everyone. If your business depends on writing deep custom rules in your error tracker, we are probably not the right choice. Same if you need session replay with browser-extension-grade fidelity. We would rather say so up front than waste your time.
There is also a category of things we will not build. Cross-site identity stitching. Third-party audience syncs. Remarketing pixels. Anything that requires a cookie or a persistent fingerprint. Those are not on the roadmap. If you need them, you need a different stack.
What we promise instead: every signal in one place, one data model, one bill, one cookie-free script, and an open source codebase you can audit and self-host. If those are worth more than specialist depth in any one category, Betterlytics is for you.
Who is Betterlytics for?
Betterlytics is for the team that is currently paying for three to five separate SaaS products to answer questions about their own site. If that is you, the math is usually easy. If it is not, this is probably the wrong tool.
More concretely, we are built for:
- Small product teams shipping fast. You do not have a dedicated observability person. You want every signal in one place because you do not have time to context-switch between five dashboards. You are happy to trade some specialist depth for the speed of having everything visible.
- Engineering-led companies. You want a small script, an honest data model, and the ability to read the code. You would rather pay for a tool you could rebuild yourself than for a tool you cannot.
- Self-hosters. Government, healthcare, fintech, defense. Anyone who cannot put visitor data on third-party infrastructure. The self-hosted build is the same product as the cloud build, and the installation docs are written assuming you mean it.
If you want to see what the dashboard actually looks like before deciding, the live demo is open. If you want a head-to-head with a specific tool you already use, our comparison pages cover the most common ones (linked from the footer). If the all-in-one shape is the bet you want to make, you can start a free account, check pricing, or pull the source from GitHub and host it yourself.
We are a small team. If you want to talk to us before any of that, we are on Discord. We are glad you are here.